Query workspace
A query tab in Explorer is where you write and run queries against your connected data sources, your endpoint fleet, or the Huntbase entity graph. Every query tab has the same layout: a query bar along the top, an optional parameter strip below it, and a results pane that fills the rest of the tab.
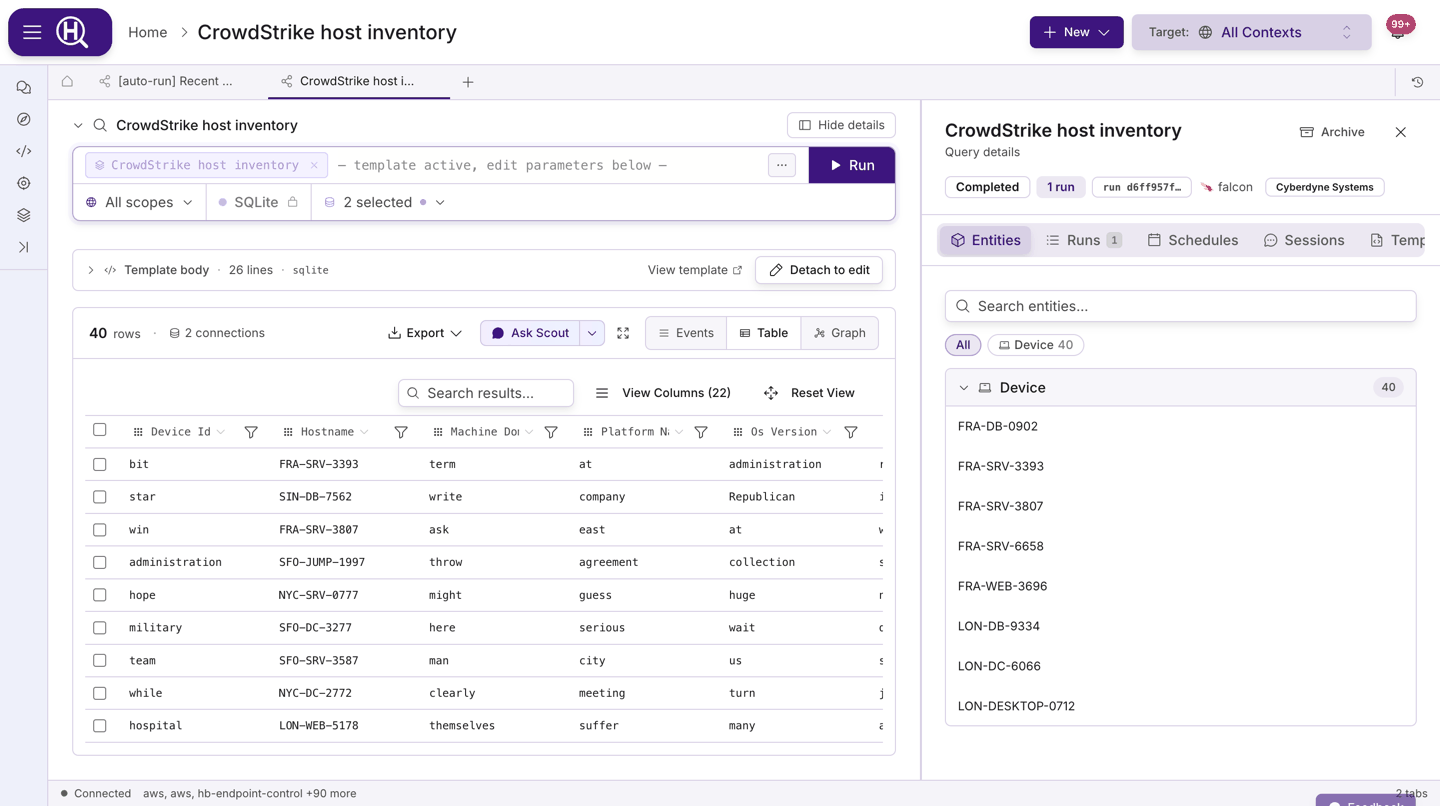
Open a query tab
You can reach a query tab from several places:
| From | How |
|---|---|
| Explorer home | Switch the launcher to Query and type a query or a description. |
| Library › Queries | Open a query template and click Run in explorer. The template's language and parameters are pre-filled. |
| A Scout chat | On a query card, click See Results to open that query and its run in a tab. Follow-up query suggestions from Scout also open as query tabs. |
| Activity Feed › Queries | Open a run and click Open Query to reopen the query with that run's results. |
| Deep link | Share or bookmark a query tab's URL. Opening it recreates the tab, including the run if one is referenced. |
| Explorer's + menu | New query opens a blank query tab. Search telemetry opens one in Search mode. Where new tabs are available, + opens a new tab: pick Query (or let Auto recognise your query), and the ▾ next to it lists New query and Search telemetry. |
Tabs stay open while you move around Explorer, so a long-running query keeps streaming when you switch to a chat or a hunt.
Search and Query modes
This feature is currently rolling out and may not be enabled for your organization.
When searching telemetry is available, a Search / Query toggle sits at the left of the bar. Query is the query editor this page describes. Search searches the telemetry your shippers send, and you filter it by clicking values. Huntbase writes the search as a query, and Query (or Show as query) shows that KQL (Huntbase Lake) query, ready to run as it is. See Search telemetry.
In a new tab, the same search is a language: Search (Huntbase Lake) is first in Query's language pill.
The query bar
The query bar groups everything the run needs, left to right: which language, which connections, the time window (for some languages), the query itself, and Run.
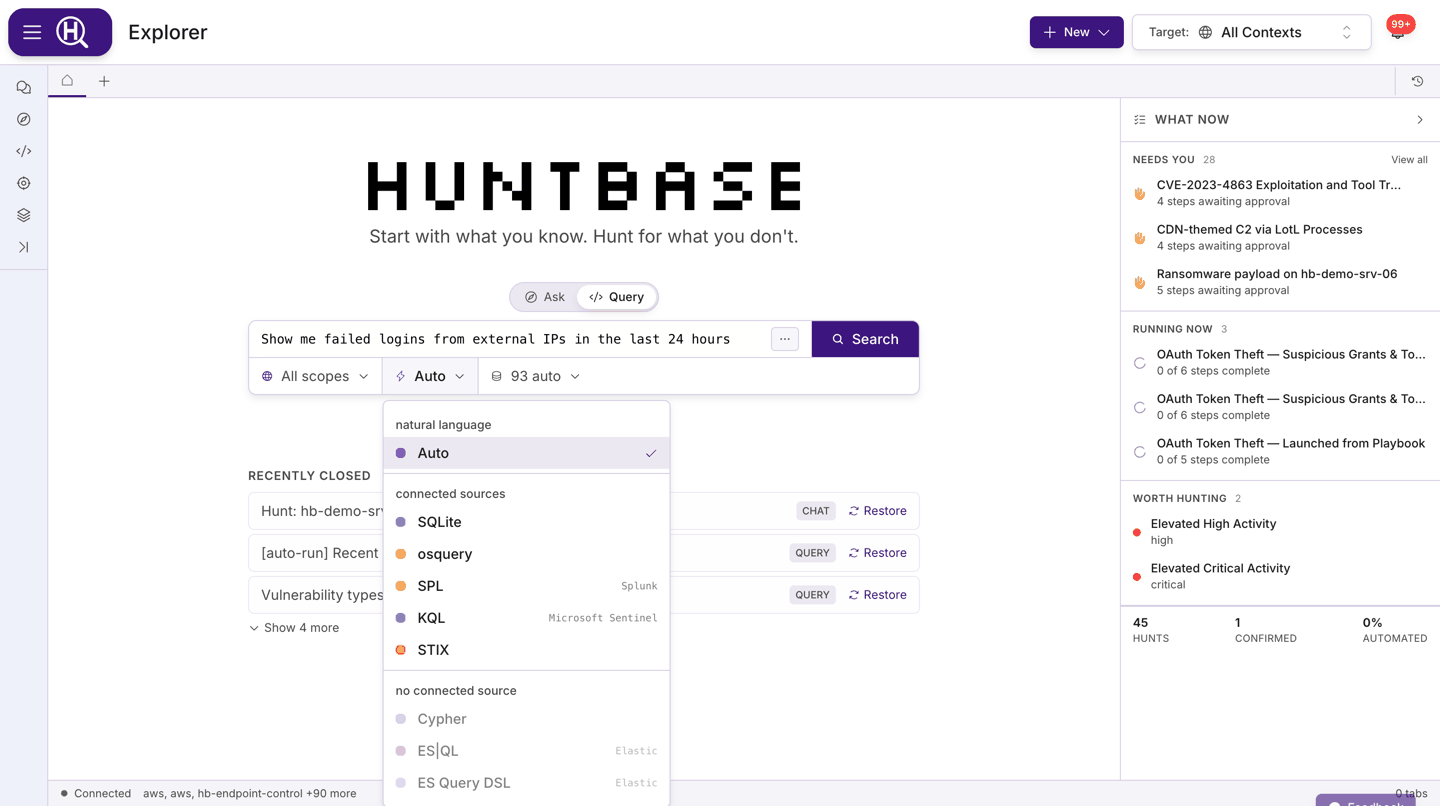
Choose a language
The first pill picks the query language. Click it to open the menu:
| Language | What it runs against |
|---|---|
| Auto | Describe what you're looking for in plain language — Scout translates the prompt into a query. |
| SQLite | Unified SQL across all connected data sources. |
| osquery | SQLite over your endpoint fleet — endpoints as tables. |
| Cypher | Graph query language for entity-relationship analysis. |
| SPL | Native passthrough to Splunk. |
| KQL | Native passthrough to Microsoft Sentinel / ADX. |
| ES|QL | Native passthrough to Elastic (piped syntax). |
| ES Query DSL | Native passthrough to Elastic (Lucene query string). |
| STIX | STIX 2.1 pattern expressions, translated per connection. |
The menu is grouped by what your connections can serve: natural language, then connected sources, then no connected source. Languages in the last group are dimmed but still selectable, so you can draft a query before the matching connection exists. When a template is active, the language is locked to the template's language.
See Query languages for syntax and examples.
Choose connections
The connection pill lists the connections in your current scope that serve the selected language. Auto-select (the default) runs across all of them; tick one or more connections to run manually against just those. When you run against more than one connection, results are merged into one result set.
Some languages need no connection at all, and the pill says which source they read instead: Entity graph for Cypher, or Data lake for KQL (Huntbase Lake), which searches the Huntbase data lake and every lake of yours in federation at once.
When your organization has lakes of its own in federation, KQL (Huntbase Lake) shows a Stores pill in place of Data lake. Run reads the Huntbase data lake and your lakes unless you pick Huntbase Lake only there. The ▾ next to Run also offers Run including your lakes for a single run. The compact bar's summary names the stores the last run read.
Target endpoints (osquery)
With osquery selected, an extra fleet pill appears. It has two modes:
- Filter — narrow the fleet by tag, operating system, or hostname pattern. No filters means the whole fleet.
- Exact — search hostnames and hand-pick specific endpoints.
A live preview at the bottom of the picker shows how many endpoints match.
Open a query targeted at endpoints
This feature is currently rolling out and may not be enabled for your organization.
You can also start from the endpoints themselves. In Endpoints, select endpoints and click Run query on these, or click Run query on an endpoint's page. Explorer opens a new query tab with osquery selected and the run limited to exactly those endpoints.
A banner above the editor reads Targeting N endpoints and names them. Watch it before you run:
| Banner | Meaning |
|---|---|
| Targeting N endpoints | The run is limited to the endpoints you chose. If you change the picked endpoints, the banner adds "opened for N" so you can see the difference. |
| "No longer limited to the N endpoints this tab was opened for — the run now follows the fleet filters." | The targeting was edited away, so the query would run more widely than you intended. Click Restore targeting to put it back. |
| "Not limited to the N endpoints this tab was opened for — endpoint targeting only applies to osquery." | You switched to another language. Switch back to osquery, or click Restore targeting. |
The banner also tells you when some of the endpoints can't be found in the fleet (offline, removed, or not yet enrolled — they stay targeted by ID), or when a fleet they belong to isn't available in your current scope.
If Explorer can't carry the selection over, it warns The endpoint selection didn't carry over and nothing is targeted. Run the query again from Endpoints rather than running the blank tab, which would cover the whole fleet.
Set the time range
For KQL (Huntbase Lake), SPL, KQL, ES|QL and ES Query DSL, a time-range pill sits next to the editor. Click it to choose a preset or a custom window; the window is sent with the run. Changing only the time range and running again runs over the new window, and reopening an earlier query puts its time range back in the pill. Other languages express time in the query body, so the pill is hidden for them.
A new query starts on Last 24 hours for KQL (Huntbase Lake), as Search does, and on Last 1 hour for languages that query one of your connected tools, so an untouched query never asks your SIEM for a day of data. Run in new tab carries the time range to the new tab.
Write the query
The editor highlights syntax for the selected language and offers autocomplete as you type — table and column names for SQL-style languages, keywords for the others, and parameter types after {{name:. Inline markers flag syntax problems before you run.
- Press Enter to run when the editor is a single line.
- Open the ⋯ menu at the right of the editor and choose Expand editor for a multi-line editor. In expanded mode, Enter inserts a new line and Cmd/Ctrl+Enter runs. Collapse editor switches back.
- Show context / Hide context toggles the row of connection and template context above the editor.
Typing in the editor also searches the Library: matching query templates appear in a dropdown so you can pick one instead of writing from scratch.
Browse the schema
Choose Schema from the ⋯ menu to open the schema tree. It lists what the selected language can query, grouped as platform › dataset › columns, with a filter box at the top. Expand a platform to load its datasets; click a dataset or column to insert its name into the editor. Use the refresh control to reload the schema.
Use parameters
Write {{name}} anywhere in a query to make it a parameter. Add a type with {{name:type}} — for example {{days_back:number}} or {{severity:enum[low,medium,high]}}. Names may contain letters, digits, underscores and hyphens.
As soon as the query contains a parameter, a parameter strip appears under the query bar with one field per parameter. Required parameters are marked with *, and Run stays disabled until every required parameter has a value. Templates opened from the Library use the same strip.
Supported types: string, number, boolean, datetime, date, list, enum[...], json, secret. See Query languages › Parameters.
Run the query
Click Run (or press Enter). While the run is in flight the button reads Running and the results pane shows progress steps — dispatched, connecting, running, streaming — until the first rows arrive. In Auto mode with a plain-language prompt, the button reads Search and searches your Library for matching templates instead of running a query. A query you type on Auto runs in its own language instead: the language pill switches to it, and for SQL the dialect follows the tables the query names and the connections in scope. If no connection serves that language, the bar says so and nothing runs. To look up an entity, use the command palette.
A run moves through these states:
| State | Meaning |
|---|---|
| Queued | Accepted and waiting to start. |
| Running | Executing; rows stream in as they arrive. |
| Completed | Every connection returned. |
| Partial | Some connections succeeded and some failed. The rows shown are from the connections that succeeded, and a warning banner says how many failed. |
| Failed | The run did not complete. A banner shows the reason reported by the run. |
| Cancelled | The run was stopped before completing. |
You can keep working elsewhere in Explorer while a run streams; the tab picks it up again when you return.
Refine a query in place
This feature is currently rolling out and may not be enabled for your organization.
When you edit a query and run it again, the new run replaces the results in the same tab. While it runs, the previous rows stay on screen, dimmed. To keep the old results and run the edited query somewhere else, choose Run in new tab from the ▾ next to Run or from the ⋯ menu, or press ⌥⌘Enter (Mac) or Alt+Ctrl+Enter (Windows/Linux).
The run list. The results header shows Run N of N with ◀ and ▶. Step back to an earlier run and its results load from what was stored, without running the query again. Click the label to see every run in this tab. When you're looking at an earlier run, Edit from this run puts that run's query, language and connections back in the bar.
The compact bar. After a run, the query bar shrinks to one row: the language, the query on one line, a summary of the connections and time range, and Run. A dot marks a query you've edited since the last run. Click the row, or press / or ⌘/Ctrl+E, to expand the full bar. Nothing you set is lost when it shrinks.
Work with results
Results open in the view that best fits their shape, and you can switch views from the toolbar:
| View | Shows |
|---|---|
| Events | One collapsed line per event; click a row to expand every field. |
| Table | A column grid — the default for most result sets. |
| Graph | The entities in the results and how they relate. Available when rows resolve to entities. |
| Map | Rows plotted by location. Available when rows carry coordinates. |
What the run tells you about itself
Some runs come back with notices above the results. They are there because a result set that looks complete but isn't is worse than an error:
| Notice | What it means |
|---|---|
| Showing the first N rows | A row cap was applied. Add | take N to change it. |
| Searched N stores | A lake query read several stores. Expand it to see which, and narrow to one from there. |
| N stores were excluded | A warning, not a footnote: a store was unavailable, or today's scan budget for your own lakes is used up, so your results may be incomplete. The notice links to the connection so you can see why. |
| Your lake wasn't searched | The run didn't ask for your lake, for example a query that Auto ran. Include it runs the query again with your lake. |
| A column is empty for some events | No mapping exists for that field in those events, so the rows are empty rather than guessed. |
Lake results also carry a store column showing which store each row came from; you can filter to a single store from a row.
When results contain a timestamp field, a time toolbar and a histogram of events over time appear above the results. Brush the histogram or pick a window to narrow the rows you see; every filter you apply is listed in a filter bar so you can clear them in one place.
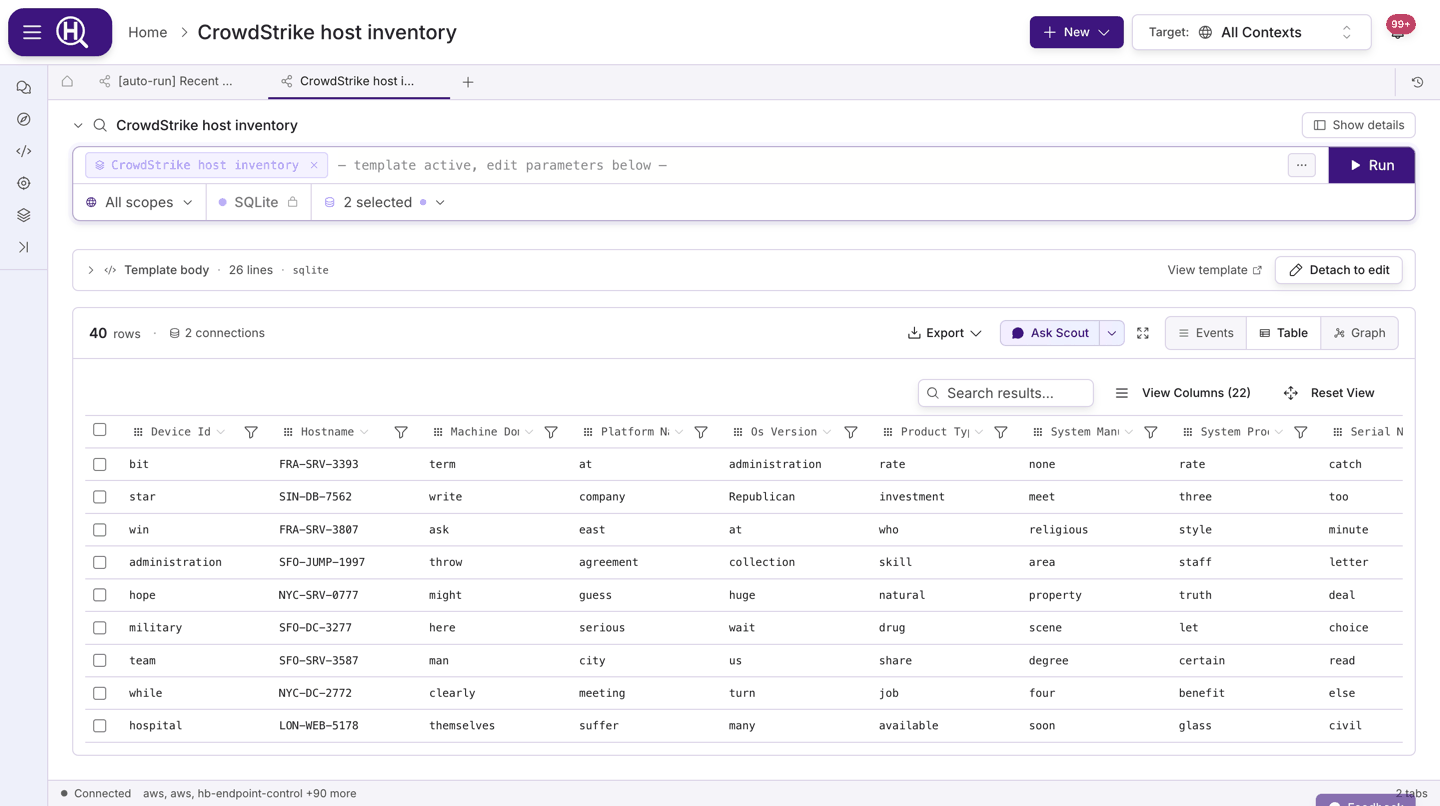
Table features
- Sort by clicking a column header; click a header's field name to open a field stats popover with top values and cardinality for that column.
- Filter per column using the filter control in each header, or use Search results… to search across all loaded rows.
- View Columns shows, hides and reorders columns; drag headers to reorder or resize inline. Reset View returns to the defaults. Column settings belong to the tab, so other query tabs keep their own.
- Rows load as you scroll — the table keeps fetching until the whole result set is on screen.
- Right-click a row for the row context menu: Copy row JSON, Tag row / Tag cell, Add note / Add cell note, Add to timeline…, Start hunt from this row (or from N rows when several are selected), and Explore in graph. Tags and notes are saved with the row; see Tags and notes and Investigation timeline.
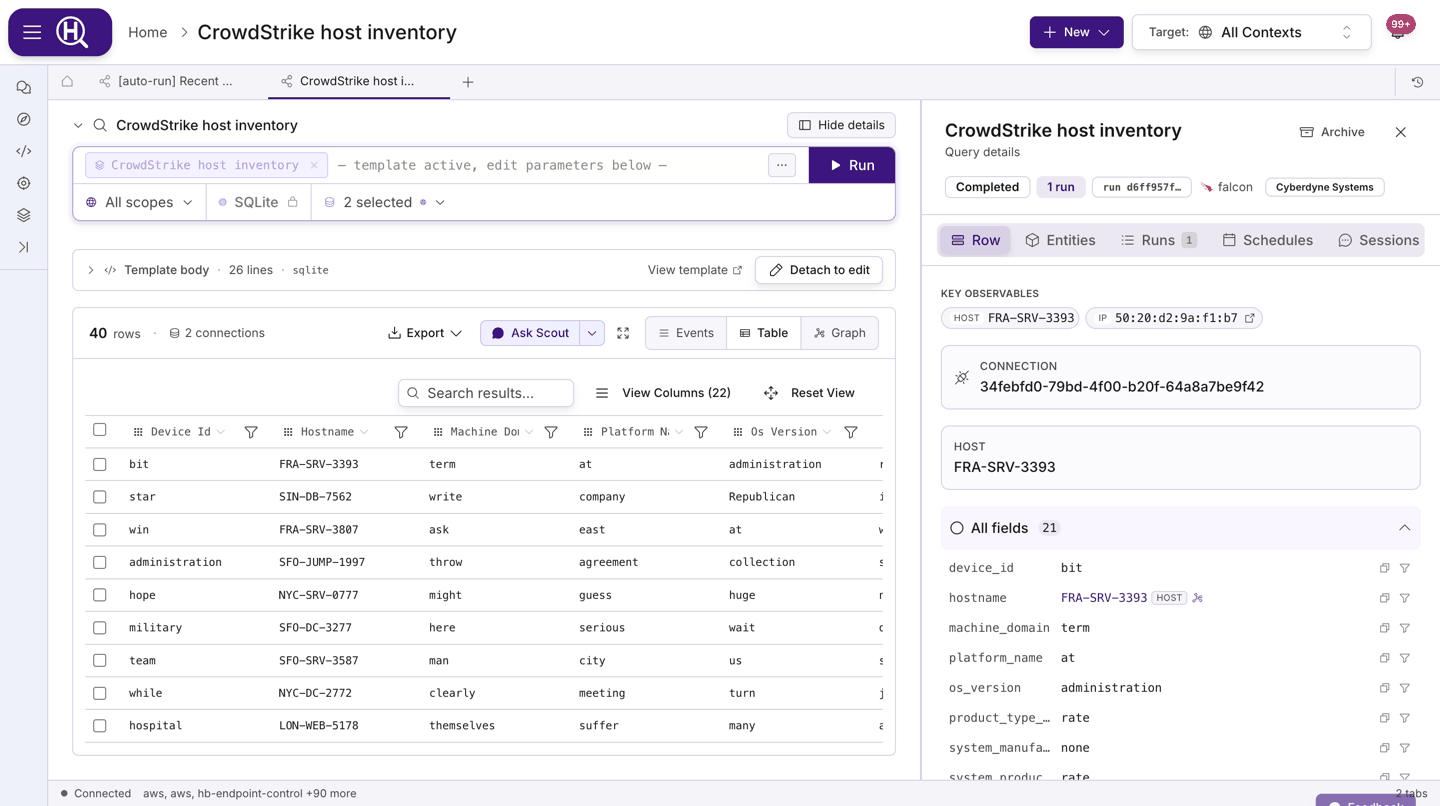
- Click a row to open the row detail panel beside the table. It shows the key fields, observables you can pivot on, the source endpoint and connection, All fields with copy and filter actions per value, and Provenance (the query and run that produced the row). Copy JSON copies the full row.
Filters wait for Apply
This feature is currently rolling out and may not be enabled for your organization.
Filters you pick from the results don't run the query straight away. Click a cell value, a value in the row detail panel, or a top value in a column's field stats (≠ excludes it), and it's queued as a dashed chip in a Not applied row above the results. Queue as many as you need, then click Apply N filters: Huntbase adds them all to the query and runs it once. × on a chip removes that filter, and Discard drops them all.
Filters wait like this on queries that run on your connections, because each run goes to the connection. In a search of your telemetry, a filter you click applies at once.
Export results
Click Export in the results toolbar and choose Export as CSV or Export as JSON. The export covers every row the run returned, not just the rows loaded on screen. Small exports download immediately; larger ones are prepared in the background — you'll get a notification with a link to the export page, which shows the format, row count and size, and a Download button once the file is ready.
Ask Scout about results
This feature is currently rolling out and may not be enabled for your organization.
Click Ask Scout in the results toolbar to open a chat that already knows about this query and its results. From the same control you can choose Summarize results for a one-shot summary. See Chatting with Scout.
Questions about what's on screen go to Scout in the dock, with that context attached. Ask Scout about this row in the row detail panel sends the row itself. After a run, the dock doesn't summarize by itself; click the Summarize results chip when you want a summary. See Scout in the dock.
Add results to a hunt
This feature is currently rolling out and may not be enabled for your organization.
Add to hunt in the results header adds this query to a hunt as a step, pinned to the run you're looking at. It goes to the hunt picked in the tab bar, or use its ▾ to choose another open or recent hunt, or New hunt from this. Once added, the tab is linked to the step: the header shows Step with the step's title and Show in notebook, and later runs in this tab update the step. See Add work to a hunt.
A search of your telemetry that you started from a new tab can be added the same way. In its tab, Add to hunt sits next to Save view.
Save and reuse
After a run, the ⋯ menu next to the editor gains two actions:
- Save as template opens a modal with Name, Description, Tags, Product (required), Supported Platforms (osquery only), a Parameters editor for anything detected in the query, and a Body preview. Click Save template to add it to Library › Queries. See Query templates.
- Start hunt turns the current query and its results into a new hunt. See Hunts.
Run history
Every run is recorded in Activity Feed › Queries, grouped by query, with its status, connections and row count. Open a run there and click Open Query to bring it back into a query tab. See Activity Feed.
Next steps
- Query languages — syntax and examples for every language
- Query templates — save, share and parameterize queries
- Schedules — run a query on a recurring schedule
- Search telemetry — search your shipped telemetry, filter it by clicking, then show it as a query
- Hunts — escalate a query result into a hunt