Test data
Library › Test data is the Huntbase test lake: a catalog of public attack recordings and real-world baseline telemetry, loaded and parsed into the same tables as your own data. Use it to see what a technique really looks like in the logs, to test a detection before it goes near your estate, and to check a hunt query finds something before you run it on your telemetry.
Every dataset is reference data. It isn't from your environment, it is never mixed with your organization's telemetry, and it can't be used as evidence in a customer hunt. Wherever it appears — the Library, Explorer, a notebook cell, a detection test, a Scout answer or a dataset citation — it carries the same orange Test data mark. Huntbase won't add test data to a hunt: Add to hunt is off on a Search tab over test datasets and on a Scout answer whose only evidence is test data, and the hover text says why.
The first time you open Test data, a short introduction explains the test lake and offers a Test a detection button and three questions to ask Scout:
- Show me what T1003.001 looks like in logs
- Write a rule for LSASS dumping and prove it on attack data
- How noisy is this rule on normal activity?
Clicking a question opens Scout and asks it. Dismiss the introduction with ×. It stays dismissed in this browser.
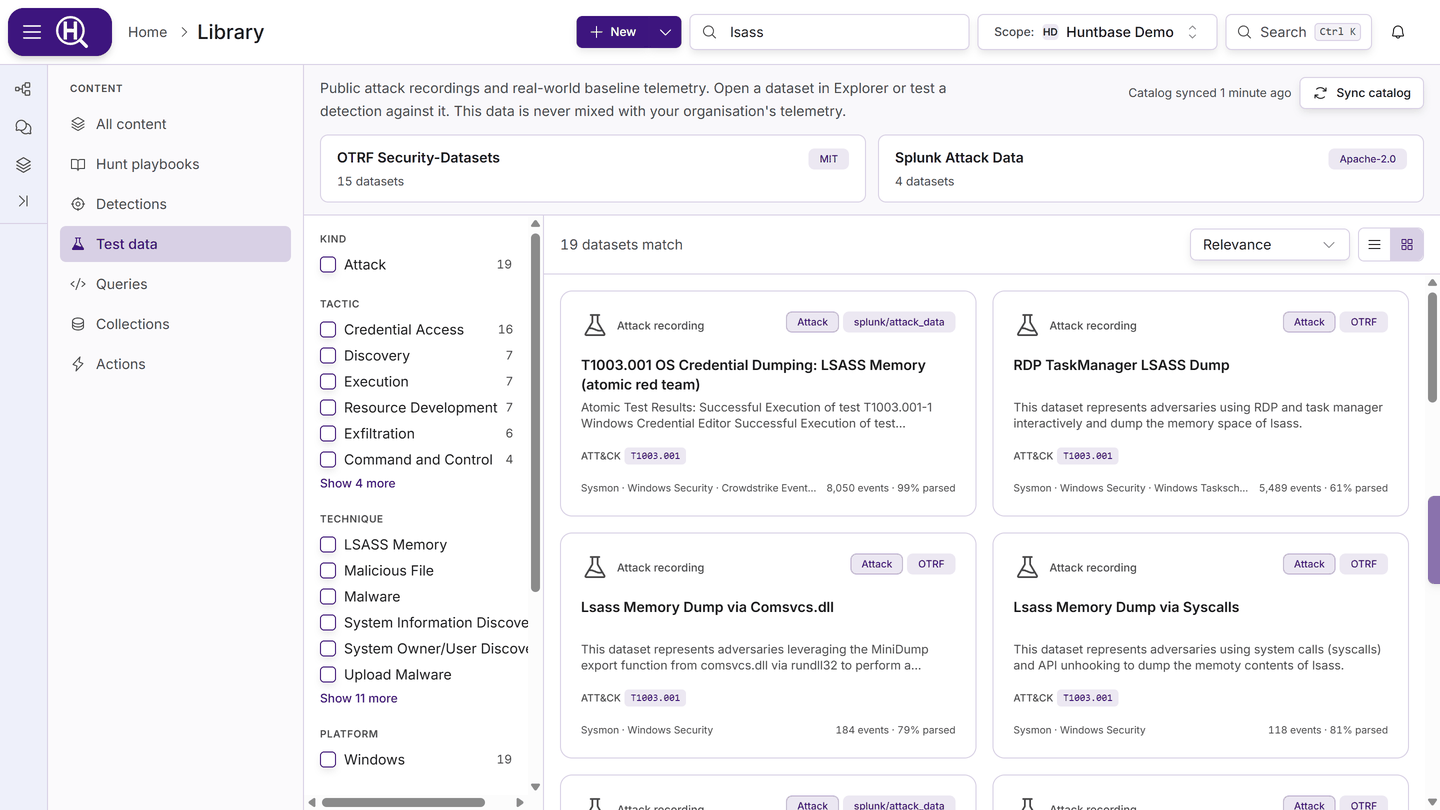
What's in the test lake
Each dataset is one of three kinds:
| Kind | What it is |
|---|---|
| Attack recording | Telemetry captured while an attack or an Atomic Red Team test ran, tagged with the MITRE ATT&CK techniques it exercises |
| Baseline | Normal activity with no attack recorded, for counting false positives |
| Attack + baseline | A recording that holds both, often with per-event ground-truth labels |
The datasets come from three public sources. Each source tile at the top of the page shows its licence and how many datasets it holds. Click a tile to list only that source's datasets.
| Source | What it holds | Licence |
|---|---|---|
| OTRF Security-Datasets | Recordings of adversary techniques, mostly on Windows hosts, from the Open Threat Research Forge | MIT |
| Splunk Attack Data | Attack recordings from Splunk's attack_data project, many of them Atomic Red Team tests | Apache-2.0 |
| Los Alamos National Laboratory cyber-security data | Large-scale authentication, process, network flow, DNS and Windows host events from LANL's corporate network (the cyber1 and Unified Host and Network 2017 sets), with labelled red-team activity | CC0-1.0 |
Browse and search datasets
- Open Library and select Test data in the facet rail.
- Type in the Library's search box to search the catalog, for example
lsass. On a narrow screen, where the header search is hidden, use the search box at the top of the page. While a search runs, the count reads Searching… and the previous results are dimmed. - Narrow the list with the filters on the left. Each option shows how many datasets it matches across the whole catalog.
| Filter | Options |
|---|---|
| Kind | Attack recordings, baselines, or both |
| Ground truth | Datasets whose events carry ground-truth labels |
| Tactic | MITRE ATT&CK tactic |
| Technique | One or more ATT&CK techniques |
| Platform | For example Windows or Linux |
| Log type | For example Sysmon, Windows Security, PowerShell, Zeek, Authentication or Network flows |
| Source | The upstream source, the same as clicking its tile |
Searching from All content also checks the test lake: when datasets match, a line above the results reads, for example, 4 test datasets match "lsass" in Test data, and opens them.
Applied filters show as chips above the list. Remove one from its chip, or clear them all. Sort by Relevance, Most events, Recently loaded or Title, and switch between cards and rows with the view toggle.
Each card shows the kind, the source, a Labelled chip when events carry ground truth, an Anonymised chip for anonymised data, up to three ATT&CK techniques, the log types, the event count and how much of the dataset was parsed. A dataset nothing could be parsed from yet reads raw only, not parsed yet: you can search it in Explorer, but detection tests can't use it.
Read a dataset
Select a card to open the dataset's page. The header shows its kind, source and platforms, the title and description, and two actions: Open in Explorer and Test a detection.
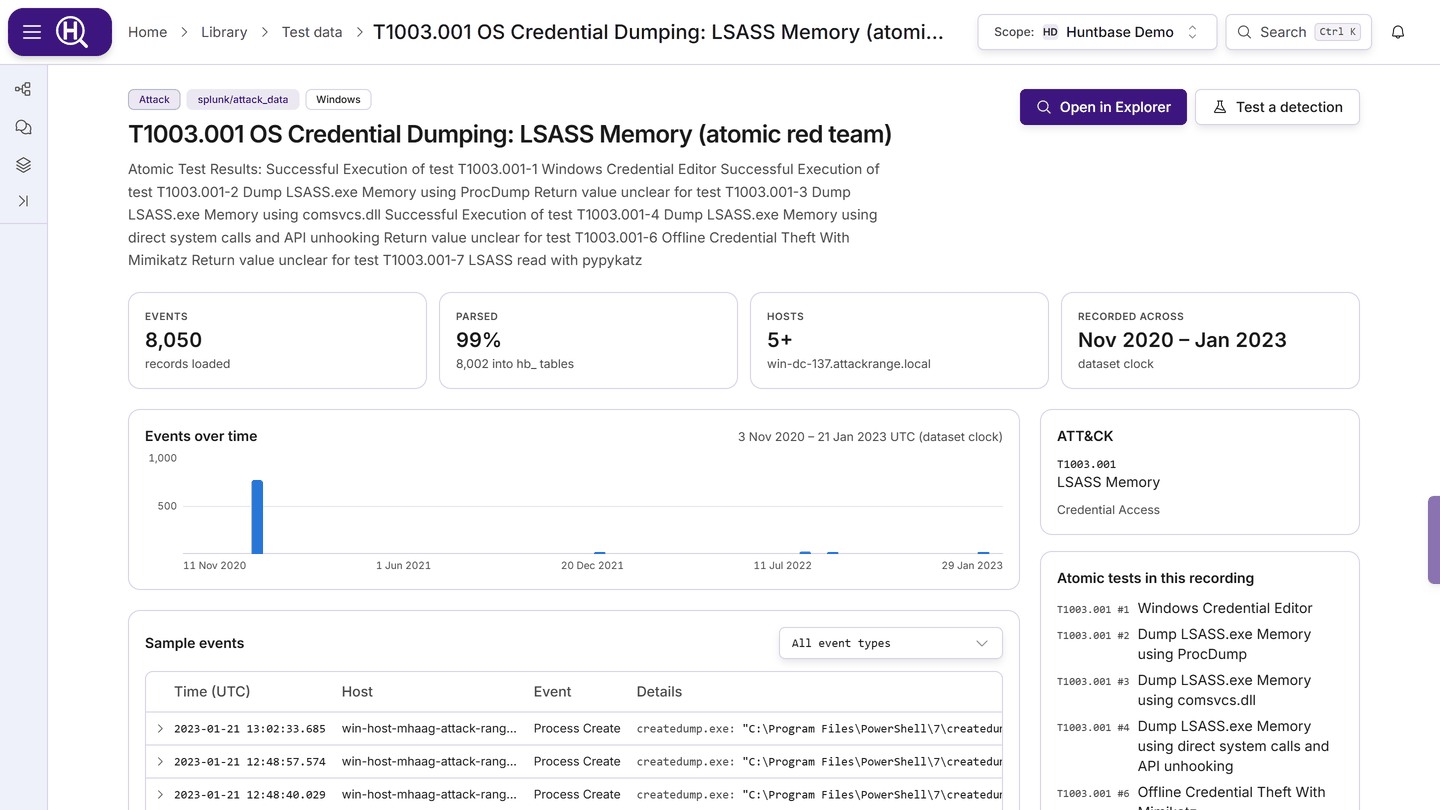
| Section | What it shows |
|---|---|
| Events | How many records were loaded |
| Parsed | The share of records parsed for detection tests and lake queries, or Raw only when none could be parsed yet |
| Host, Hosts seen or Ground truth | The host in a single-host recording, the number of hosts seen in the sample, or Labelled when events carry per-event labels |
| Duration or Recorded across | How long the recording ran, or, for a dataset assembled from recordings made months apart, the months it spans |
| Events over time | The volume of events across the recording, on the dataset clock. A line beside it reads, for example, Recording: 18 May 2019 – 20 May 2019 UTC, and says what a relative range in Explorer will cover. |
| Sample events | The first events, with Event time (UTC), host, event type and the key details. The event time is the event's own timestamp when one was found, otherwise when the record was loaded. Expand a row for the full event and copy it as JSON. Pick an event type to see only that type, and on a labelled dataset tick Labelled events only. Open all events in Explorer opens the whole dataset. |
| Log files | Each upstream file with its format, record count and whether it's Parsed for detection tests: Parsed, Partly (N%) or Raw only. Raw records are still searchable in Explorer. |
| ATT&CK | The techniques and tactics the recording covers |
| Atomic tests in this recording | The Atomic Red Team tests that ran, by technique and test number |
| Log types | The log types, with event counts per event class (for example Process activity) |
| Source and licence | The source, licence, upstream identifier, citation and references. Copy citation copies the citation, and View upstream opens the original. |
Every recording keeps the timestamps it was captured with, often years ago. Times on a dataset page, and in Explorer when you open a dataset, follow the dataset clock rather than today's date. Relative ranges count back from the end of the recording: Last 24 hours on a recording that ended at 17:02 UTC on 20 May 2019 means 17:02 on 19 May to 17:02 on 20 May 2019. Dates from a past year always show the year.
Anonymised datasets
The LANL datasets are anonymised at source. Their pages say so at the top: users look like U66@DOM1 and computers like C1065. These values are tokens, not real users or hosts, and they never become entities in Huntbase.
Open a dataset in Explorer
Open in Explorer opens a Search telemetry tab on the dataset, over its own recorded time range. Everything you can do with your own telemetry works here: search, filter by clicking values, read the Fields tab and the volume strip, expand events and Show as query. See Search telemetry.
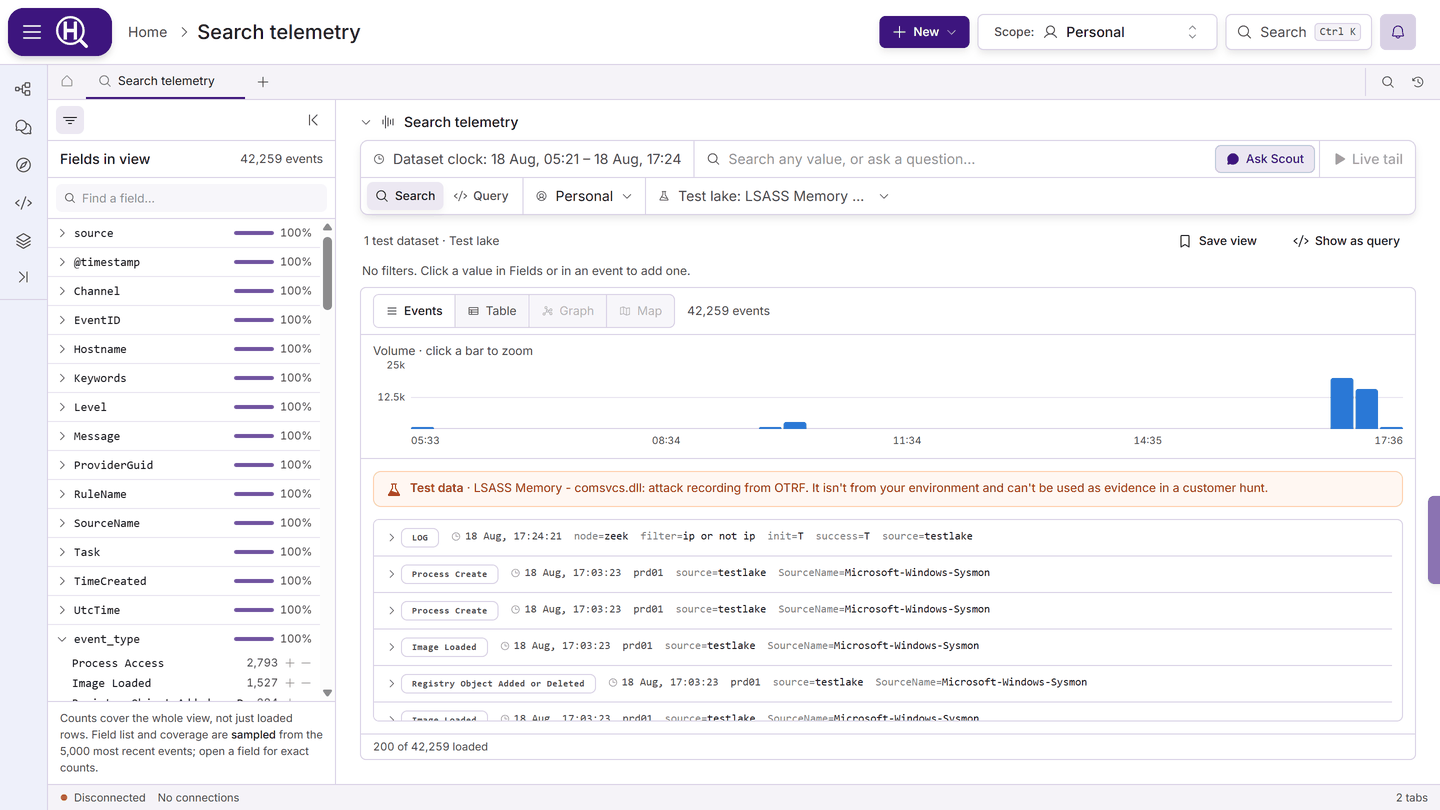
You can tell you're on test data at a glance:
- The time range reads Dataset clock. The time menu explains that ranges count back from the end of the recording, and offers Whole recording.
- The line under the bar reads, for example, 1 test dataset · Test lake, followed by the recording line: Recording: 18 May 2019 – 20 May 2019 UTC · "Last 24 hours" = the last 24 hours of the recording, up to 20 May 2019 17:02 UTC.
- A one-line Test data banner above the events names the dataset and its source. Hover it for the full text.
Times in the table, the events list, the expanded event and the volume chart follow the table's TZ toggle: UTC by default, or your local time.
To add more datasets, open the source picker. Test datasets are listed in their own Test lake group, which you can search by title, technique or source. Datasets you've picked stay at the top of the group whatever you search for, and Browse all test data in the Library is at the bottom.
With more than one dataset picked:
- Each row names the dataset it came from, in the Dataset column of the table and on each event.
- If the recordings don't overlap in time, the view opens on the whole recordings, so the older one isn't hidden by a range counted back from the newer one. When a relative range leaves a picked dataset with no events, the recording line says so and offers Show the whole recordings.
In Table view the volume chart starts hidden, to leave room for rows; show it with the chart button, and Huntbase remembers your choice. A view reads either test datasets or your own sources, never both, so picking a dataset while your sources are selected starts the selection over. Live tail is off on test data, since a recording has nothing live to tail.
Test a detection
Run a detection over attack recordings and baselines to see what it catches, what it misses and how noisy it is. The test runs only on the test lake. Your telemetry isn't touched unless you choose to include it.
You can start a test from:
- a dataset's page, with Test a detection;
- the Test data introduction, with Test a detection;
- a Sigma rule in Library › Detections, with Test on attack data, which opens the test with the rule filled in;
- the watcher editor, with Test on attack data (see Test a watcher on the test lake).
- Open Test a detection, for example on a dataset's page.
- Choose the rule: Paste a Sigma rule, or pick One of your watchers.
- Under Datasets, choose This dataset, or Attack recordings matching the rule's ATT&CK tags. With the second, keep Include baselines, to count likely false positives ticked.
- Under Options, choose whether to Explain misses and to Include my recent telemetry (see Check the rule's quality).
- Click Run test.
A test can take a minute on large recordings. While it runs, the dialog shows what it's testing and how long it has taken, with Cancel to stop it. If the test can't run, the dialog says why, for example a rule without ATT&CK tags when you chose the recordings matching its tags. Add tags: such as attack.t1003.001 to the rule, or test it on a single dataset from its page. A rule that doesn't compile shows the compile error, with a hint and the fields you can use.
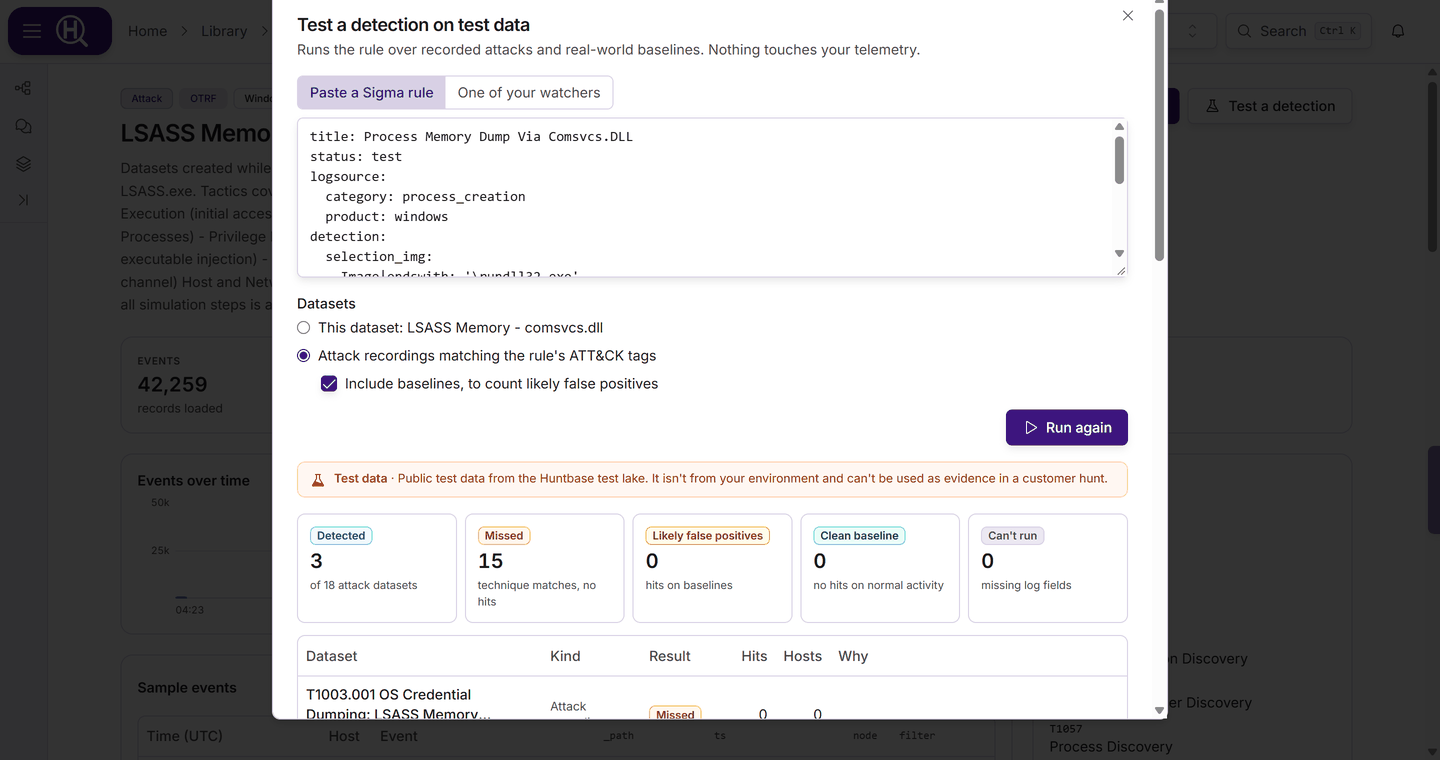
The report starts with summary tiles, then one row per dataset with its kind, result, hits, hosts and why. On a narrow screen the kind and hosts columns are hidden. Select a dataset to open its page. Copy report copies the whole report as text.
| Result | What it means |
|---|---|
| Detected | Hits on an attack recording of a technique the rule covers |
| Missed | The technique matches, but the rule found nothing |
| Off-technique hits | Hits on a recording of techniques the rule isn't tagged with. Check them before counting them either way. |
| Likely false positives | Hits on baseline activity, where no attack was recorded |
| Clean baseline | No hits on normal activity |
| No hits | No matches in this dataset |
| Can't run | The dataset lacks the fields or tables the rule needs |
Every report, Scout card and watcher backtest also states what the test found about noise on normal activity: Noise not measured when no baseline ran, Noise: incomplete when a baseline was skipped or only partly read, or the measured result. A Clean baseline count only appears once noise has been measured in full, so "0 false positives" never stands in for a test that didn't run.
On labelled datasets, the Why column also counts labelled true and false positives. A sampled marker means a large dataset was sampled rather than read in full, so its counts are a floor.
Turn a passing rule into a watcher
When the rule detects at least one attack recording, the report shows how many it caught and a Create watcher button. It opens the watcher editor with a new watcher, the tested rule and its title filled in. If the rule also hit baselines, the report says so, so you can tune it first. The watcher is created like any other, in your organization. See Watchers.
Explain misses
With Explain misses on, missed attack recordings get Why it missed on their row in the results table. Click it to open the explanation under the row. Only the first few misses are explained, and a note above the table says how many, for example Explained 5 of 15 misses. Each explanation shows:
- Why the rule missed: for example, the recording holds no events of the rule's log source, the rule's fields aren't in the events, or its values never occur.
- What the attack left: the distinctive field values in the attack window, by event type, with how often each appears and example rows.
- Draft rule: a minimal Sigma rule built from the strongest signals, marked as an untested draft. Copy it, or click Test this draft to load it into the rule box and run it straight away.
Check the rule's quality
Every report includes a Rule quality block with a verdict:
| Verdict | What it means |
|---|---|
| Ready | No lint errors, clean baselines and a quiet history: fit to propose |
| Needs work | Fix the listed issues (lint, a baseline hit, missed recordings) and test again |
| Noisy | It fires on normal activity: many baseline hits, or many hits a day in your telemetry |
The block lists the reasons behind the verdict, the result on Baselines, and Lint findings such as search terms that are too short or generic, or an image match with no path. With Include my recent telemetry ticked and an organization in scope, it also shows Your telemetry: how many hits a day the rule would have produced on your own data, or that it found none in that window (which can also mean you don't collect the data the rule needs yet).
You can run the same test from a watcher. See Test a watcher on the test lake.
Ask Scout to use the test lake
Scout can search the test lake, show you a technique in real rows, write and test detections, explain misses, and check hunt queries before they run. Its answers cite the datasets it used, and every card is labelled as test data. When Scout tests a draft, fixes it and tests again in one answer, only the last test is shown open. Earlier drafts are folded and marked as superseded. If an answer states a verdict, such as a rule being ready, while some of its claims have no supporting evidence, a warning under the answer says how many and asks you to check them first. An answer whose only evidence is test data can't be added to a hunt. See Scout and the test lake.
Cite a dataset
The datasets are published by their authors under the licences above. When you use one in your own work, cite it. The citation is on each dataset's page under Source and licence, with Copy citation. The LANL datasets ask for these citations (the first two for cyber1, the third for Unified Host and Network 2017):
- A. D. Kent, "Comprehensive, Multi-Source Cyber-Security Events", Los Alamos National Laboratory, 2015, doi:10.17021/1179829.
- A. D. Kent, "Cybersecurity Data Sources for Dynamic Network Research", in Dynamic Networks in Cybersecurity, Imperial College Press, 2015.
- M. J. M. Turcotte, A. D. Kent and C. Hash, "Unified Host and Network Data Set", in Data Science for Cyber-Security, World Scientific, 2018, pp. 1–22.
Next steps
- Search telemetry: search and filter a dataset in Explorer
- Watchers: backtest a rule on the test lake before you turn it on
- Chatting with Scout: write, test and improve detections with Scout
- Detections: the detection templates you can enable