Pulse
Pulse is the outcomes dashboard: the ROI of your threat-hunting programme — outcomes, value and maturity — rather than a count of what ran. Where the Activity Feed is your desk today, Pulse is the programme over months. Open it from Pulse in the sidebar.
Time window and deltas
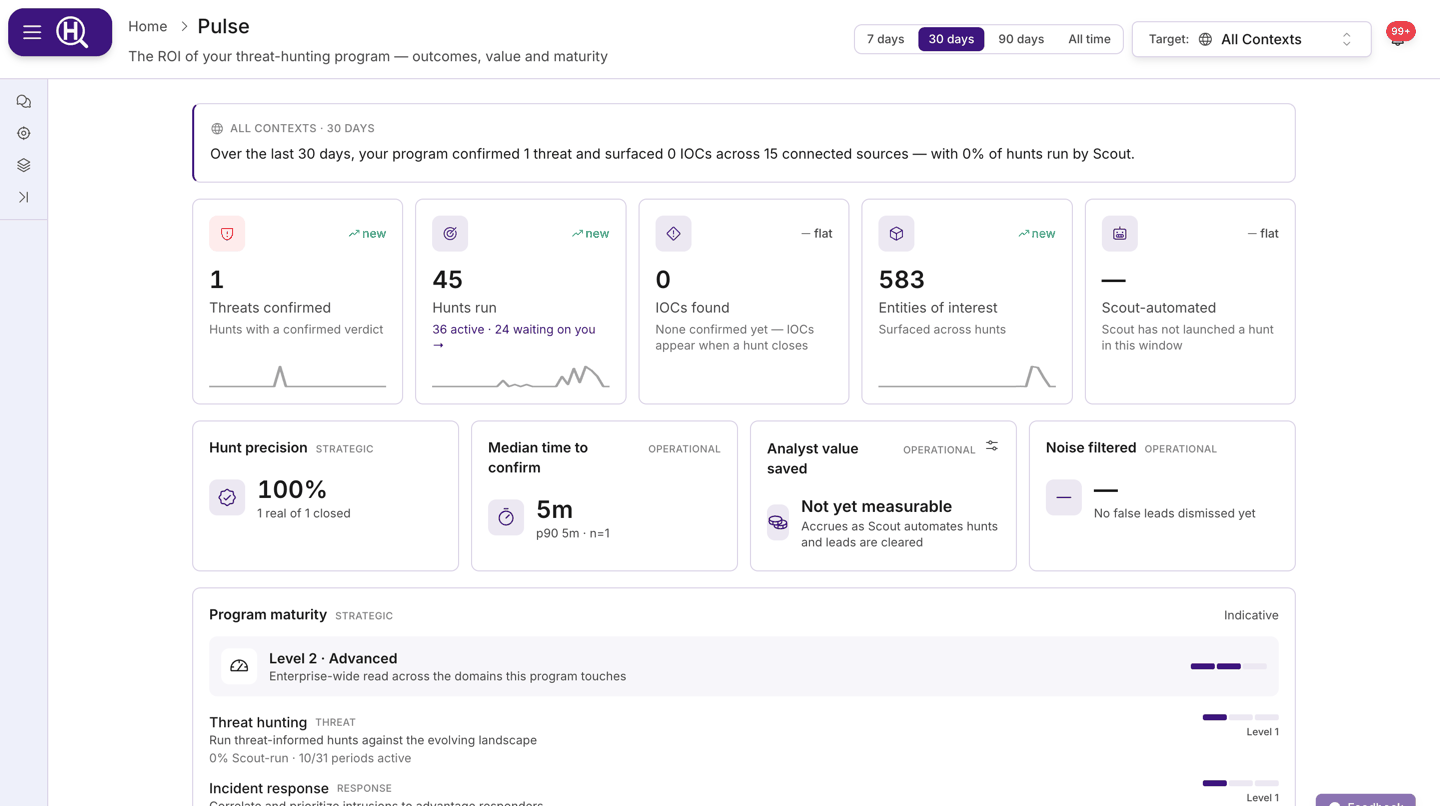
Choose the window in the page header: 7 days, 30 days (default), 90 days or All time. Every card recomputes for that window, and the summary card's eyebrow reminds you which scope and window you're looking at (for example "Acme Corp · 30 days"). Pulse respects the Scope selector, so switch scope to compare teams or organizations.
Most tiles carry a delta chip comparing the window with the previous period of the same length ("+12%", "new" when the previous period was zero, "flat" when nothing changed). Deltas are hidden for All time, which has no previous period.
The summary
The card at the top states the programme in one sentence: "Over the last 30 days, your program confirmed 4 threats and surfaced 31 IOCs across 6 connected sources — with 78% of hunts run by Scout." If nothing has been confirmed yet, it says so and notes how many hunts are still waiting on a verdict; if no hunts ran, it prompts you to connect a source and run one.
Cards
Headline tiles
| Tile | What it measures |
|---|---|
| Threats confirmed | Hunts closed with a confirmed verdict. When none are confirmed but hunts are waiting on a verdict, the caption links to the triage lane. |
| Hunts run | Hunts in the window, with how many are still open and how many need someone on the team (linked to triage). |
| IOCs found | Indicators of compromise surfaced by hunts. IOCs appear when a hunt closes. |
| Entities of interest | Entities surfaced across hunts. |
| Scout-automated | The share of hunts launched by Scout rather than a person, and the count behind it. |
Each tile also carries a small sparkline for the window.
The tiles' links to triage, such as N hunts awaiting a verdict → and Review in triage →, open the Activity Feed's triage lane on the same window Pulse is showing, with All assignments on, so the hunts behind the number are the ones you see, whoever they are assigned to.
Value and signal quality
| Card | What it measures |
|---|---|
| Hunt precision | Of the hunts that reached a verdict, the share that were real threats: confirmed ÷ (confirmed + dismissed). Shown as a percentage with "N real of M closed". |
| Median time to confirm | Median time for a hunt to reach a confirmed verdict, with the p90 and the sample size it was computed from. |
| Analyst value saved | An estimate of analyst hours (and money) the programme has saved: hours per automated hunt × hunts Scout ran, plus hours per false lead × leads dismissed, priced at your cost per analyst hour. |
| Noise filtered | False leads dismissed before escalation. |
Analyst value saved uses assumptions you control. Click the sliders icon (Edit value assumptions) on the card to set Cost / analyst hour, Hours saved / automated hunt, Hours saved / false lead and Currency, then Save. Values must be greater than zero. The assumptions are saved on the server, so everyone looking at Pulse sees the same figure.
Analyst value saved is an estimate built from your own assumptions. Present it as such.
Program maturity
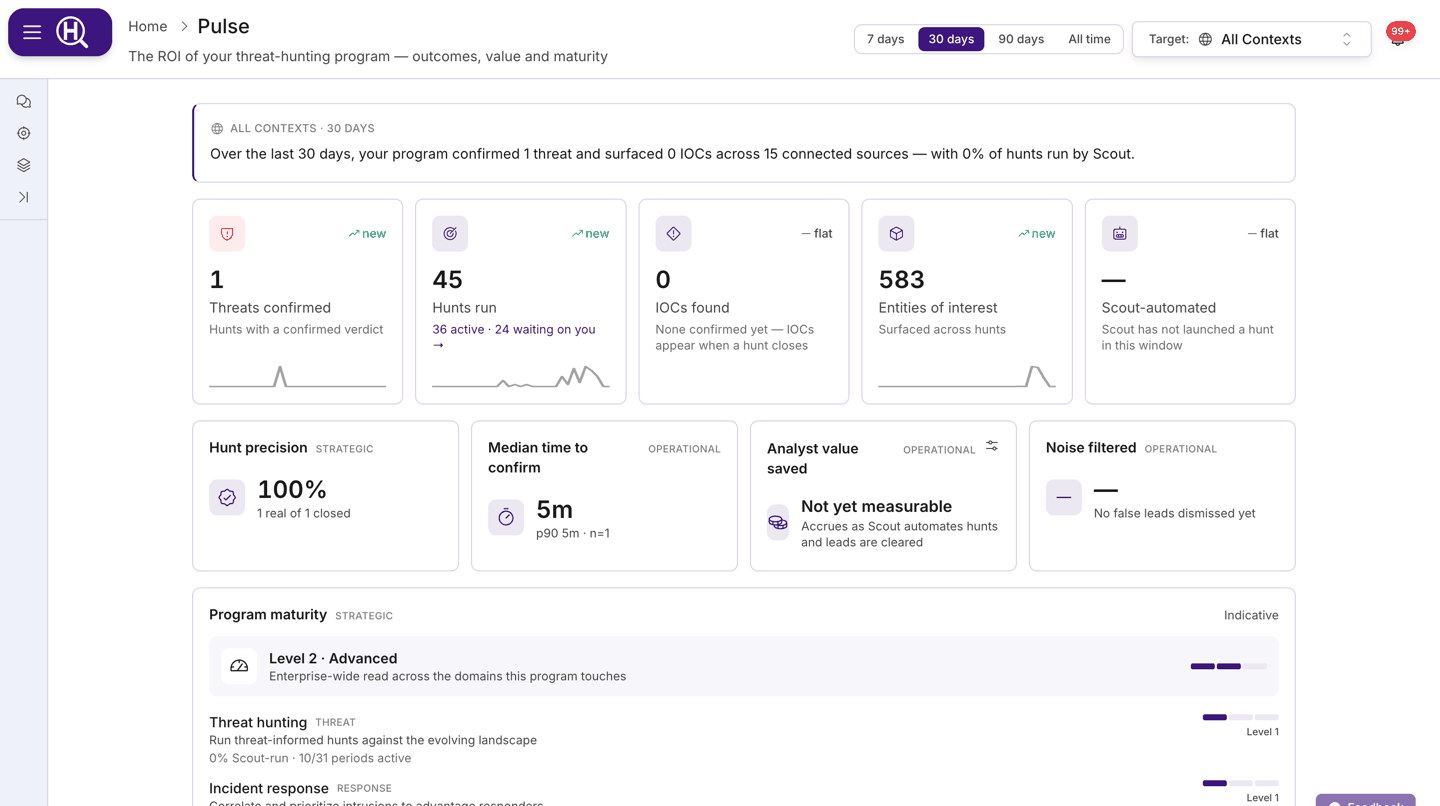
An indicative maturity read across four domains, modelled on the CTI-CMM. Each domain shows its mission, a level badge and a one-line rationale drawn from your actual activity, and the header rolls them up into an enterprise-wide level on a three-step ladder.
| Domain | Mission | What moves the level |
|---|---|---|
| Threat hunting | Run threat-informed hunts against the evolving landscape | Hunts run, the share Scout runs, how many periods in the window had activity, and whether threats were confirmed. |
| Incident response | Correlate and prioritize intrusions to advantage responders | Threats confirmed and actions taken. |
| Situational awareness | Threat-informed visibility across your attack surface | How many sources are connected. |
| Program management | A repeatable, measurable hunting program | Cadence — how consistently hunts run — and whether the trend is up. |
Levels run Level 0 · Pre-foundational, Level 1 · Foundational, Level 2 · Advanced, Level 3 · Leading. The card's footnote is the caveat: this is derived from observed activity, not a formal assessment.
Verdicts, severity, findings and coverage
| Card | What it shows |
|---|---|
| Hunt verdicts | Hunts by disposition: Confirmed, Low confidence, In progress, Dismissed, Abandoned, No verdict. |
| Hunts by severity | Hunts by Critical, High, Medium, Low. |
| Findings by type | The top six entity types surfaced in the window, by count. |
| Coverage | Connected sources out of the products available ("6 / 40 sources"), with a chip per connected product. A product counts as connected when it has at least one configured connection. If nothing is connected, Connect a source → takes you to Connections. Where telemetry is available, a Shipped telemetry section adds your telemetry sources by category. See Telemetry. |
Telemetry
This feature is currently rolling out and may not be enabled for your organization.
If you ship telemetry to Huntbase, Pulse can show how much arrived and how many sources are sending. There are three telemetry widgets. You'll find them in the Telemetry group when you Customize the dashboard and click Add widget:
| Widget | What it shows |
|---|---|
| Events received | Events accepted in the window across the Huntbase data lake and your own lakes, with the change from the previous period and a sparkline. |
| Sources reporting | Telemetry sources that sent data in the window, out of all your sources. |
| Telemetry volume | Events per day, split by destination: Huntbase data lake and each of your lake stores. |
When your organization has at least one telemetry source and you haven't customized the dashboard, Sources reporting is added next to Coverage in the default layout. A layout you've saved is never changed. Click any of these widgets to open Telemetry. If nothing has been shipped yet, they link there to set up a source.
These numbers come from the same counts as each source's status on the Telemetry page, so the two always agree.
Shipped telemetry in Coverage. The Coverage card lists telemetry sources by the Category you give them in Source settings (Identity, Endpoint, Network, Cloud, Email, Other). Next to each category is a meter of how much of it is actually reporting. Receiving and rejecting sources count in full, a Quiet source counts half, and a source that has never sent anything doesn't count. A source without a category counts under Other, so give each source its category to see where your gaps are. Revoked keys aren't counted.
Outcomes worth briefing
The six hunts most worth mentioning upward: highest severity first, then most recent. Each row shows the title (click to open the hunt in Explorer), its severity and status, and — once there are some — the IOC and entity counts. Brief opens the hunt's report, generating it if it doesn't exist yet. See Hunts.
Activity
Level-of-effort counts for the window, deliberately placed last: Hunts, Queries, Insights and Entities observed (every entity seen in the window — not the same as Entities of interest, which counts entities surfaced by hunts). Open the Activity Feed with the same time range when you want the rows behind a number.
Run a weekly review with Pulse
- Set the window to 7 days and pick the scope you're reviewing.
- Read the summary sentence, then Threats confirmed and Hunts run. If either caption says hunts are waiting on you, follow the link to the triage lane and clear it first — verdicts drive everything else on the page.
- Check Hunt precision and Noise filtered. Falling precision usually means a watcher or playbook is producing leads that don't hold up; see Watchers.
- Look at Coverage. Sources you expected to see missing here explain hunts that failed for lack of telemetry. If you ship telemetry, check that Sources reporting matches the number of sources you expect.
- Take Outcomes worth briefing to your stakeholders, and open Brief on anything they'll ask about.
- Switch to 30 days or 90 days to check the deltas and the maturity ladder before you close.
Next steps
- Activity Feed — the rows behind every number here
- Hunts — verdicts, severities and reports
- Watchers — the automation behind Scout-automated
- Connections — improve Coverage